
The climate and your school garden
Location on the earth determines temperatures, the energy in the sun's rays and the duration of sun in the sky by date. You need to recognize these features if you are to have a successful school garden. Specific location and geography also affects these factors. You need to particularly aware if you live in the colder regions of Canada. These factors, combined with your local micro-climates, essentially determine both heat for the cold frame or greenhouse and light for photosynthesis. The following topics are outlined below:
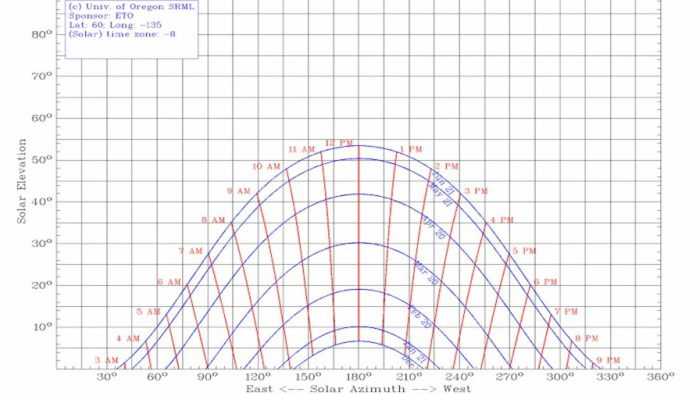
The path of the sun varies by season. The graph below shows the suns paths throughout the year for 60 deg north latitude. You can calculate your own sun's path using the website listed below. The path of the sun should help in determining the slope of the glazing on your greenhouse or cold frames. The more perpendicular to the sun's rays, the more the sun will pass through the glazing (glass, plastic, polycarbonate, etc). The amount of energy absorbed from the sun is also dependent on how high the sun is from the horizon.
|
This graph shows the elevation and azimuth of the sun at different months of the year in Whitehorse. This information should be taken into consideration when designing a greenhouse. The angle of the glazing, the direction the greenhouse faces, the glazing materials and the length of time you wish to operate your greenhouse are all affected by these factors. You can use the following web site to calculate the sun's path at your latitude.
http://solardat.uoregon.edu/SunChartProgram.html |
|
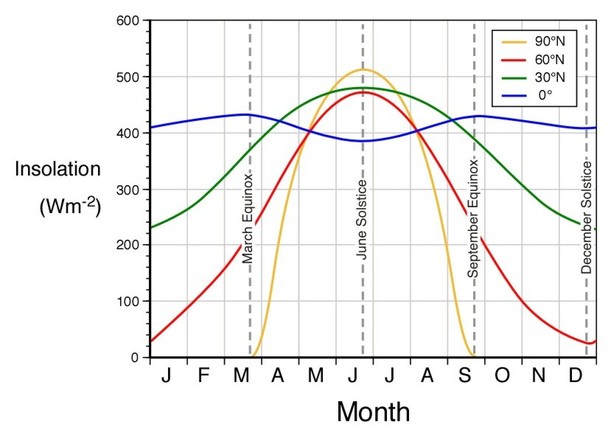
Insolation (Incoming Solar Radiation) is the amount of solar radiation hitting a perpendicular surface. The amount of insolation received at the surface of the Earth is controlled by the angle of the sun, the state of the atmosphere, altitude, and geographic location. The graph to the left shows average solar insolation at different latitudes. The Whitehorse graph, in red, shows energy above 300 watts per square meter occours between mid-April to early September. Lags in the earth cooling creates a growing season the lasts beyond September 1.
|
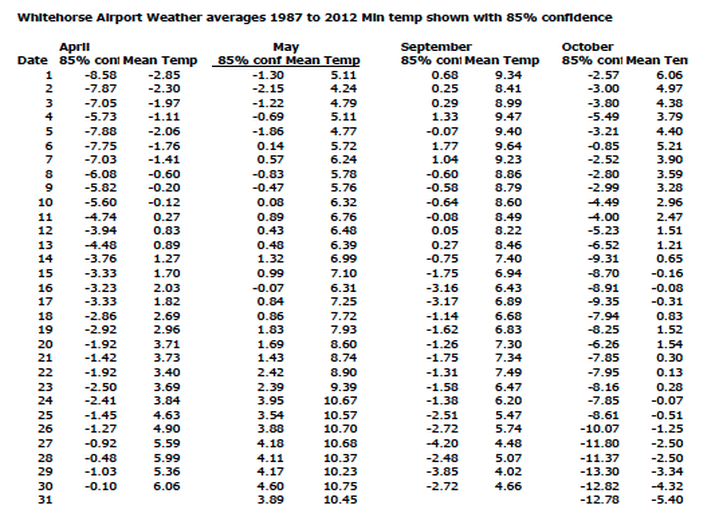
You will want to get a better idea about your growing season. To do this, go the the Environment Canada website (listed below) select the closest met station and download the monthly record of daily min, max and mean temperatures. The min temp is the one you need to worry about since, in much of Canada, it is hard frosts that kill our gardens. Even the warmer parts of the country, like Victoria BC, need to be concerned about frosts in mid winter when many of us are under snow and well frozen.
|
This graph shows the average Whitehorse weather conditions for growing months. The killing frosts, shown as one standard deviation below the average daily minimums represents an 85% probability of temperatures below this point. Growing plants in our environment means that we need to realize and work around these factors.
To calculate this graph, monthly records for a 30 year period were downloaded into a spreadsheet. Averages were calculated over this period and the 85% probability of killing frosts (-2.2c) were then calculated. http://climate.weatheroffice.gc.ca/climateData/dailydata_e.html?timeframe=2&Prov=XX&StationID=1617&Month=5&Year=2012&cmdB1=Go |
|
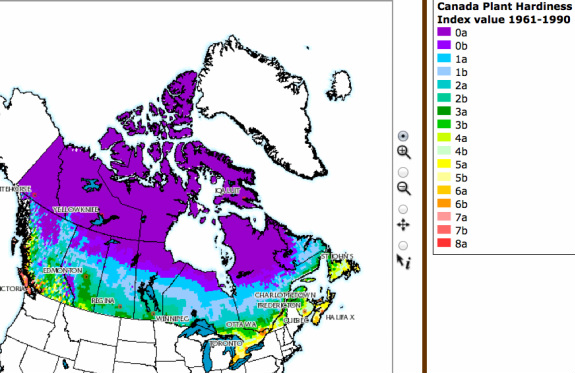
What Is A Plant Hardiness Zone?
Perennials trees and shrubs are hardy in a range of zones. In Canada we are more concerned with the coldest zone the plant can survive in. The coldest zone is 0 and the mildest zone is 9. Plants that are hardy in the colder zones cannot be grown in warmer areas because they need a cold period to set bud. Since the 1960's the zones have been re-evaluated, using seven variables like amount of rain, minimum and maximum temperatures, maximum snow depth, maximum wind gust, and plant suitability. The new interactive map can be found by clicking here. Remember hardiness zones are just a guide: micro-climate can make a difference, sometimes as much as a whole zone. |
Your local micro-climate: To determine the difference between your local micro-climate and the weather station, use a datalogger to record temperatures over a season then compare this data with that of the weather station. This should provide a general picture of how your site may differ from the local weather station.
