
Intertidal monitoring (Click here for the data sheets for intertidal monitoring)
The Shorekeepers' Guide was developed by Fisheries and Oceans Canada as an intertidal surveying methodology. The method presented a step-by-step procedure for studying intertidal zones, covering site selection, measurement procedures, data management and result reporting. The goal was to provide a process for long-term intertidal habitat monitoring designed to detect gradual changes in habitats and local biodiversity through annual data collection at the same sites with a rigorous monitoring methodology. The key to getting reliable scientific data was to use standard survey methods so that everyone is collecting data in the same way over time at all sites.
This Canadian school protocol has followed these step-by-step protocols to a large extent, only becoming more specific in the process when the conditions associated with conducting the studies with school students demanded. For example, the plot identification and plot layout, the frequency of the studies, the specific site analysis, mapping the drift wood, mapping the backshore and recording the information as a series of layers in Google Earth are all areas where the Canadian school protocols have been altered from the Shorekeepers protocols.
Identification of the Intertidal Study Area
The intertidal survey maps and documents the plants and animals found in the intertidal zone – the area between the higher high water mark and the lower low water mark. The survey also includes a description of the backshore, the area from the higher high water mark away from the shore for 20 m. This backshore area may have significant influence on the intertidal zone, due to human impacts there such as modified water runoff.
Study Area Selection
The study area should be selected to address key issues of concern. For example:
The Study Area
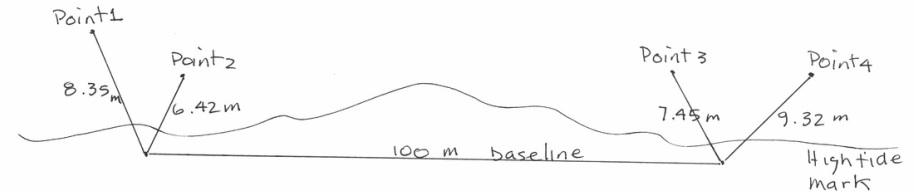
The study area should run 100 meters along a relatively straight section of shoreline that falls within the habitat of interest. A 100 meter tape laid out in a straight line along this shoreline becomes the study baseline. It is important both ends of this baseline tape be located at the same position for every survey. This requires establishing permanent reference points for both ends of the tape.
Permanent reference points may be created within the intertidal zone only on stable substrates, such as a sound bed rock surface. In these cases, a discrete concrete anchor with a bronze bolt head as the locator, situated in a rock crack, may be permanent enough to survive spring storms. Locating two permanent points on the backshore allows for locating a specific location for the baseline. These permanent markers could be metal pins driven flush to the ground or bolrts concreted into in rock cracks. The diagram below shows how two point references can locate a specific third point. The care with which the baseline is located and laid out is importnat to the accuracy of the entire survey.
The Shorekeepers' Guide was developed by Fisheries and Oceans Canada as an intertidal surveying methodology. The method presented a step-by-step procedure for studying intertidal zones, covering site selection, measurement procedures, data management and result reporting. The goal was to provide a process for long-term intertidal habitat monitoring designed to detect gradual changes in habitats and local biodiversity through annual data collection at the same sites with a rigorous monitoring methodology. The key to getting reliable scientific data was to use standard survey methods so that everyone is collecting data in the same way over time at all sites.
This Canadian school protocol has followed these step-by-step protocols to a large extent, only becoming more specific in the process when the conditions associated with conducting the studies with school students demanded. For example, the plot identification and plot layout, the frequency of the studies, the specific site analysis, mapping the drift wood, mapping the backshore and recording the information as a series of layers in Google Earth are all areas where the Canadian school protocols have been altered from the Shorekeepers protocols.
Identification of the Intertidal Study Area
The intertidal survey maps and documents the plants and animals found in the intertidal zone – the area between the higher high water mark and the lower low water mark. The survey also includes a description of the backshore, the area from the higher high water mark away from the shore for 20 m. This backshore area may have significant influence on the intertidal zone, due to human impacts there such as modified water runoff.
Study Area Selection
The study area should be selected to address key issues of concern. For example:
- You may suspect that a nearby activity is affecting the plants and animals of a particular shoreline. If so, you might want to monitor the shore area you think is being affected, as well as a reference site at another location of a similar type that you believe is unaffected. By monitoring both study areas it will be possible to compare results. However, to establish a strong correlation between cause and effect, a number of sites in the two categories (affected and reference) will need to be monitored over an extended period of years.
- You may want to describe the ecology in local intertidal habitats, or to document natural changes in community structure. For example, perhaps you are most interested in surveying a sandy beach or a rocky outcropping to describe the kinds of long-term change in habitats that may be occurring, and how species composition changes from year to year.
- You may be concerned mostly with a few particular plants or animals. If so, you will need to select a study area that contains the habitat in which those plants or animals occur.
The Study Area
The study area should run 100 meters along a relatively straight section of shoreline that falls within the habitat of interest. A 100 meter tape laid out in a straight line along this shoreline becomes the study baseline. It is important both ends of this baseline tape be located at the same position for every survey. This requires establishing permanent reference points for both ends of the tape.
Permanent reference points may be created within the intertidal zone only on stable substrates, such as a sound bed rock surface. In these cases, a discrete concrete anchor with a bronze bolt head as the locator, situated in a rock crack, may be permanent enough to survive spring storms. Locating two permanent points on the backshore allows for locating a specific location for the baseline. These permanent markers could be metal pins driven flush to the ground or bolrts concreted into in rock cracks. The diagram below shows how two point references can locate a specific third point. The care with which the baseline is located and laid out is importnat to the accuracy of the entire survey.
Once the baseline is established, UTM coordinates are taken multiple times with a GPS at each end. These are then corrected to reflect the 100 meter distance measured between the two points. The UTM coordinates are an essential part in locating the image of the study area as a geo-referenced image in Google Earth.
Frequency and Timing of Intertidal Monitoring
A class of 16 to 20 students can conduct a survey of the intertidal area survey of 100 meters along the shoreline during the period of a dropping tide to the extreme low on the day of the study. (You will need a tide graph showing time and water level at the study location.) A survey takes 4 to 6 hours for the intertidal zone and an additional two to three hours for mapping the backshore, depending on its complexity. It is important to plan to survey a study area 3 to 5 times in order to obtain baseline data against which to measure any long-term changes. If a study area is surveyed at least twice, it is monitored, and changes in the ecosystem can be recorded and causal factors may be identified. For a good look at what is happening in an area, it should be surveyed over a period of years, so that small year-to-year changes can be separated from longer term changes. In BC marine areas, surveys are usually done between April and October because low tides occur during daylight. But this does not rule out studies that reach into the dark. Marine plant and animal abundance and diversity change with the season. If a study area is to be monitored over a number of years, then it should be surveyed at the same time each year so that organisms are at the same stage in their life cycles. In this way any changes that are seen on the shore may be attributed to something other than normal seasonal rhythms in plant and animal populations.
Intertidal Habitat Identification and Mapping
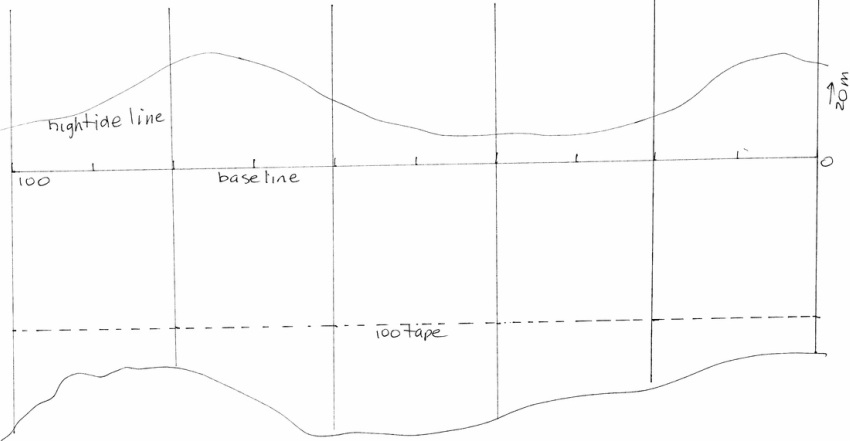
Setting out a grid: Run perpendicular 50 m tapes at 20 meter intervals along the baseline. Begin each tape at the 20 meter mark. Run the tape up the backshore and down the shoreline following the water as the tide drops. At 20 meters down the shoreline, run a second 100 meter tape parallel to the baseline. This forms a reference grid that helps in mapping the habitat areas. A blank map grid that is marked off in 2 m squares is referenced along the 100 baseline. (This grid map may be downloaded.) The image below shows an example of the tape layout that will help in accurately mapping the intertidal habitat areas.
Frequency and Timing of Intertidal Monitoring
A class of 16 to 20 students can conduct a survey of the intertidal area survey of 100 meters along the shoreline during the period of a dropping tide to the extreme low on the day of the study. (You will need a tide graph showing time and water level at the study location.) A survey takes 4 to 6 hours for the intertidal zone and an additional two to three hours for mapping the backshore, depending on its complexity. It is important to plan to survey a study area 3 to 5 times in order to obtain baseline data against which to measure any long-term changes. If a study area is surveyed at least twice, it is monitored, and changes in the ecosystem can be recorded and causal factors may be identified. For a good look at what is happening in an area, it should be surveyed over a period of years, so that small year-to-year changes can be separated from longer term changes. In BC marine areas, surveys are usually done between April and October because low tides occur during daylight. But this does not rule out studies that reach into the dark. Marine plant and animal abundance and diversity change with the season. If a study area is to be monitored over a number of years, then it should be surveyed at the same time each year so that organisms are at the same stage in their life cycles. In this way any changes that are seen on the shore may be attributed to something other than normal seasonal rhythms in plant and animal populations.
Intertidal Habitat Identification and Mapping
Setting out a grid: Run perpendicular 50 m tapes at 20 meter intervals along the baseline. Begin each tape at the 20 meter mark. Run the tape up the backshore and down the shoreline following the water as the tide drops. At 20 meters down the shoreline, run a second 100 meter tape parallel to the baseline. This forms a reference grid that helps in mapping the habitat areas. A blank map grid that is marked off in 2 m squares is referenced along the 100 baseline. (This grid map may be downloaded.) The image below shows an example of the tape layout that will help in accurately mapping the intertidal habitat areas.
Habitat Mapping
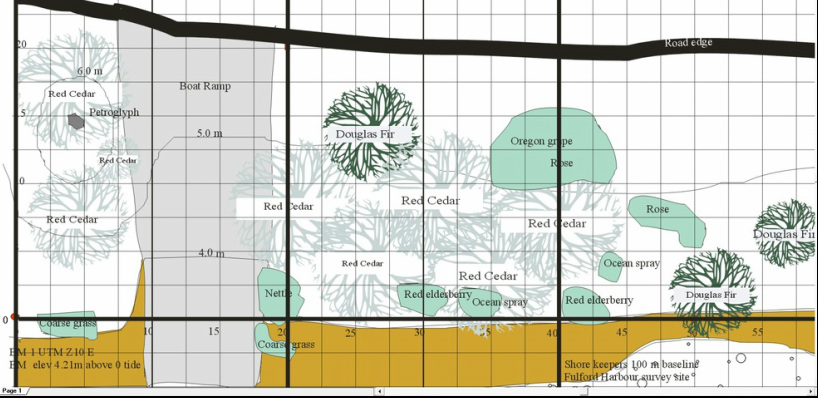
Habitats are characterized by observable features. Identify and map each habitat type, record the code for each unit and draw the habitat on the sheet. Habitats can be defined by physical and biological features including substrate, slope, elevation, temperature, humidity, vegetation and animals. Nineteen habitat types are identified using substrate and vegetation. You may need to define additional habitat if you are working outside of the BC Strait of Georgia. The nineteen habitat types are listed below with general descriptions based on the intertidal or backshore zone in which they occur. To be classified as a separate habitat, an area must be at least 25 square metres. There may be several separate units of the same habitat type in the study area, each of which is the required minimum size of 25 square metres. Treat each of these as a separate habitat unit. To classify the habitat type, simply look at the study area and pick out all the different types of habitats. Each habitat unit is classified according to one of the choices given. The most dominant feature is the one you will use. Once a type is selected, the boundaries of the habitat need to be determined. Everyone on the habitat mapping team should help with this and everyone should agree on the habitat types, and be able to visually recognize each habitat and its borders. Click here for the habitat descriptions and the baseline grid map.
After the habitats are mapped, each area is then mapped digitally and placed as a layer in a draw program that can be geo-referenced and placed as a layer in Google Earth. Subsequent years of monitoring may overlay one another. By changing the opacity of the layer, you are able to see how different areas change over time.
It is helpful to use cones or similar markers to set out each habitat area. The picture above shows how markers can be used to define a habitat. Take photographs of your habitats to ensure consistency in identification from year to year. As an example, if you have an area that is made of bedrock, but that is at least 50% covered in sea lettuce, you classify this as a sea lettuce habitat, not a rock habitat. An intertidal habitat composed of 75% bedrock and boulder, with little or no algae, is a rock habitat. Refer to the habitat substrates described on the next page to help with your habitat identifications. Estimate percent cover by assuming you are looking down on the habitat from above.
Record the type of substrate
Substrate is the material that forms the base material of the habitat. A boulder beach is a rock habitat (r) that has a boulder substrate (b). Each of the habitat units you identified probably has more than one substrate, e.g. sand, pebbles, or boulder. Substrates provide surfaces upon, below, or within which plants and animals can live. The habitat type categories are quite general. For example, a rock habitat may consist of bedrock and/or boulders and/or some pebble and a bit of sand, or it may consist of just bedrock. Recording the substrate types makes it obvious what the differences are among rock habitats.
Intertidal Sampling
Intertidal sampling involves detailed examination of quadrant plots at .5 meter elevation intervals within the intertidal zone. These quadrant plots are located along the perpendicular grid lines found at 20 meter intervals along the baseline. The elevations may be located by using a tide graph and watch. To determine the intertidal elevation, locate that elevation of the graph, then determine the time at which the tide elevation will occur. Extend the grid lines to water level at the specified time. This will mark the location of the quadrant plot.
Place the quadrant at the specified locations. The type of analysis you undertake will depend on the substrate. On rock shores, examine and count algae and animals found within the area, also estimate the percent cover of the different living things. On finer grained materials, (cobbles to mud) , record the surface algae and animals , then dig down 10 cm, sieving the materials to pick out animals that live below the substrate, next repeated the process to a depth of 30 cm. You may need to keep a pan of water nearby so that the sieve can be washed to help out in the sorting process. Record all animals found at different depths on the surface and in the substrate. The picture above shows the first step in examining the surface of a quadrat plot. Click here for forms to record data from the quadrant plots
Driftwood Monitoring
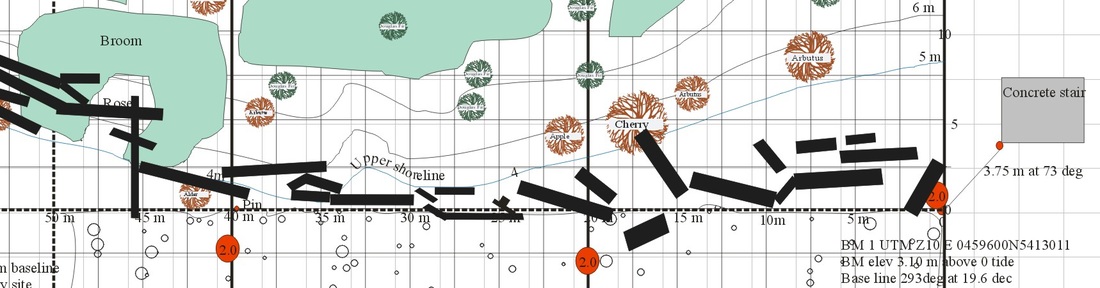
Many logs found along the high tide mark may appear to be long-term residents of a beach, but measurements and mapping the drift wood shows the dramatic movement of these logs. The driftwood monitoring protocol measures and maps the position and size of these logs. All measurements are based on distances along the 100 meter baseline. Both sides and both ends of each log are measured and plotted in reference to the baseline. This will give both log diameters and log length. The image above shows the process in action. The image below shows the map and log locations following the plotting the driftwood on a computer program. Each square on the plot below represent 2.5 meters. All driftwood has been plotted to scale.
Habitats are characterized by observable features. Identify and map each habitat type, record the code for each unit and draw the habitat on the sheet. Habitats can be defined by physical and biological features including substrate, slope, elevation, temperature, humidity, vegetation and animals. Nineteen habitat types are identified using substrate and vegetation. You may need to define additional habitat if you are working outside of the BC Strait of Georgia. The nineteen habitat types are listed below with general descriptions based on the intertidal or backshore zone in which they occur. To be classified as a separate habitat, an area must be at least 25 square metres. There may be several separate units of the same habitat type in the study area, each of which is the required minimum size of 25 square metres. Treat each of these as a separate habitat unit. To classify the habitat type, simply look at the study area and pick out all the different types of habitats. Each habitat unit is classified according to one of the choices given. The most dominant feature is the one you will use. Once a type is selected, the boundaries of the habitat need to be determined. Everyone on the habitat mapping team should help with this and everyone should agree on the habitat types, and be able to visually recognize each habitat and its borders. Click here for the habitat descriptions and the baseline grid map.
After the habitats are mapped, each area is then mapped digitally and placed as a layer in a draw program that can be geo-referenced and placed as a layer in Google Earth. Subsequent years of monitoring may overlay one another. By changing the opacity of the layer, you are able to see how different areas change over time.
It is helpful to use cones or similar markers to set out each habitat area. The picture above shows how markers can be used to define a habitat. Take photographs of your habitats to ensure consistency in identification from year to year. As an example, if you have an area that is made of bedrock, but that is at least 50% covered in sea lettuce, you classify this as a sea lettuce habitat, not a rock habitat. An intertidal habitat composed of 75% bedrock and boulder, with little or no algae, is a rock habitat. Refer to the habitat substrates described on the next page to help with your habitat identifications. Estimate percent cover by assuming you are looking down on the habitat from above.
Record the type of substrate
Substrate is the material that forms the base material of the habitat. A boulder beach is a rock habitat (r) that has a boulder substrate (b). Each of the habitat units you identified probably has more than one substrate, e.g. sand, pebbles, or boulder. Substrates provide surfaces upon, below, or within which plants and animals can live. The habitat type categories are quite general. For example, a rock habitat may consist of bedrock and/or boulders and/or some pebble and a bit of sand, or it may consist of just bedrock. Recording the substrate types makes it obvious what the differences are among rock habitats.
Intertidal Sampling
Intertidal sampling involves detailed examination of quadrant plots at .5 meter elevation intervals within the intertidal zone. These quadrant plots are located along the perpendicular grid lines found at 20 meter intervals along the baseline. The elevations may be located by using a tide graph and watch. To determine the intertidal elevation, locate that elevation of the graph, then determine the time at which the tide elevation will occur. Extend the grid lines to water level at the specified time. This will mark the location of the quadrant plot.
Place the quadrant at the specified locations. The type of analysis you undertake will depend on the substrate. On rock shores, examine and count algae and animals found within the area, also estimate the percent cover of the different living things. On finer grained materials, (cobbles to mud) , record the surface algae and animals , then dig down 10 cm, sieving the materials to pick out animals that live below the substrate, next repeated the process to a depth of 30 cm. You may need to keep a pan of water nearby so that the sieve can be washed to help out in the sorting process. Record all animals found at different depths on the surface and in the substrate. The picture above shows the first step in examining the surface of a quadrat plot. Click here for forms to record data from the quadrant plots
Driftwood Monitoring
Many logs found along the high tide mark may appear to be long-term residents of a beach, but measurements and mapping the drift wood shows the dramatic movement of these logs. The driftwood monitoring protocol measures and maps the position and size of these logs. All measurements are based on distances along the 100 meter baseline. Both sides and both ends of each log are measured and plotted in reference to the baseline. This will give both log diameters and log length. The image above shows the process in action. The image below shows the map and log locations following the plotting the driftwood on a computer program. Each square on the plot below represent 2.5 meters. All driftwood has been plotted to scale.
Backshore Mapping
The first step is to find out if the backshore (the land away from the shore) is privately owned or owned by First Nations. You can check this out by downloading the cadastral information(land ownership) as a layer on Google Earth using the following steps: This information may be downloaded on Google Earth from the following site: http://clss.nrcan.gc.ca/googledata-donneesgoogle-eng.php. click on the Canada Lands overlay and for the download. Select your study province or territory, the appropriate zone then, the appropriate map sheet for information around your site . You only need to do this once since the information is stored as a Google earth layer on your computer. When you move the cursor onto a block, it is highlighted and information is provided about the block. Record the block plan. Examine your site to determine if the backshore is privately owned.
The backshore zone is of interest here because it affects the intertidal zone. Backshore plants can affect the intertidal zone through shading, by stopping erosion, and by holding water. As a result, you need to survey plants in the backshore zone. If you cannot get into the backshore zone because it is private property or a protected area, then make sure you give a good description of what you see from the beach, and record what you see on the study chart. If you can gain access, then complete the following instructions and record and map the results.
- Measure back 20 m from the line where the intertidal zone ends and the backshore zone begins.
- Run a 100 meter tape offset by 20 meters and parallel to the intertidal base line. You can use the perpendicular tapes as a reference and a mapping guide.
- If the backshore is dense salal or forest, it will be difficult to actually string a rope. Take time to set out the parallel line.
- Map the location of all trees, brush clusters and any human disturbances.
- Revisit the backshore mapping periodically over a period of years.
Cate to add eel grass surveys and others involved in costal surveys: note also grab samples for subtidal
